NSBE Data Visualization Workshop Review
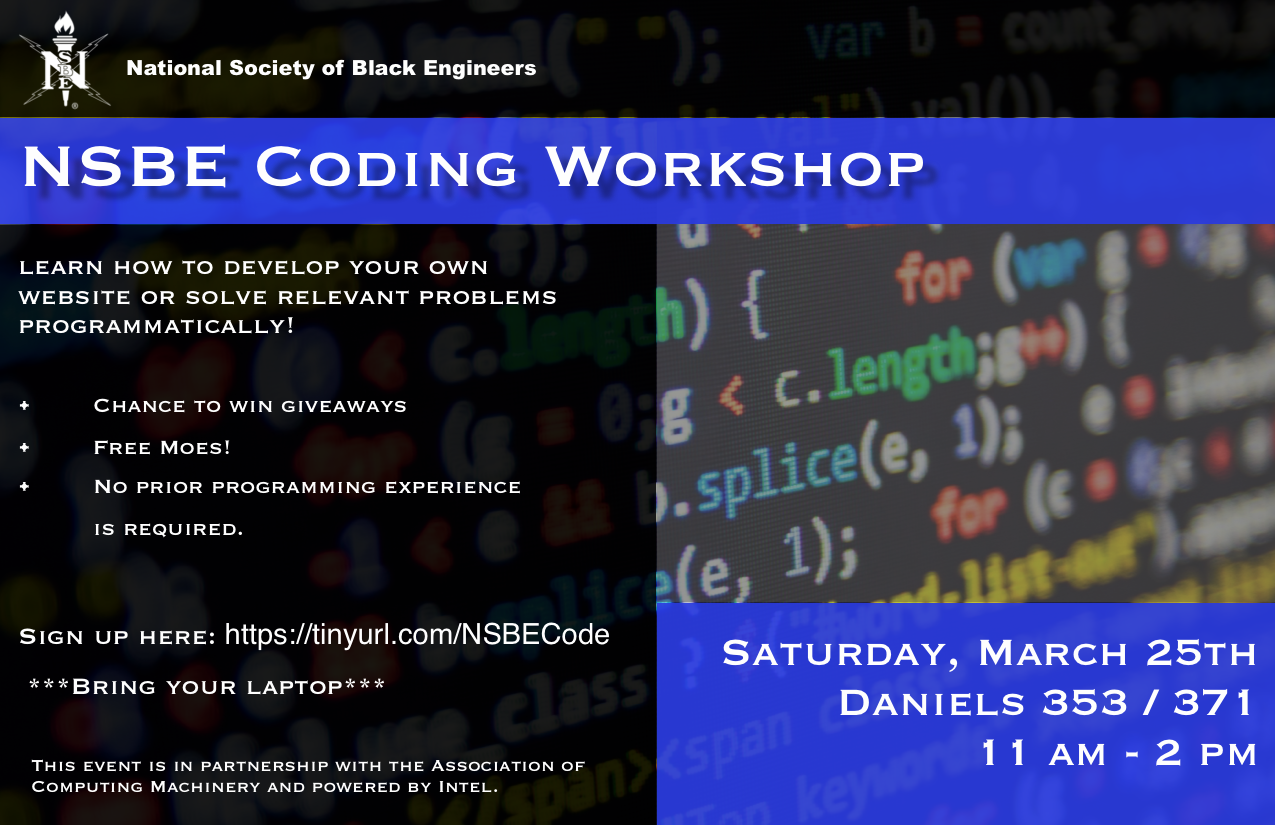
In partnership with NC State’s National Society of Black Engineers chapter, ACM/AITP hosted a data visualization workshop, intended for beginners to programming!
The workshop was on Saturday, March 25 from 11 AM to 2 PM, and was in Daniels Hall, room 353 on Main Campus. The event was graciously sponsored by Intel, and catered by Moes! There were 3 exercises that students took part in:
-
An introduction to Python - here, participants worked with multidimensional arrays defined using the Numpy Python package, since this would be necessary later on for data visualizations. The tasks were designed to build familiarity with the Python syntax, and Numpy ways of doing things.
-
A beginner exercise - this one was targeted at using imported data for graph generation with Matplotlib. There were 2 versions, one for less experienced programmers which was more concrete in instruction and with more code given, and an intermediate version with more freedom in implementation and task. The imported data set was on enrollment data for NC State’s College of Engineering.
-
A multi-dataset analysis - using the dataset from the previous exercise, and one on educational benchmarks across different races in NC’s public school system, students had to create a meaningful graph using the two datasets.
The students learned a lot, and many had a great time. Our officer team helped people with installing Python, syntax issues, and algorithm ideas for accomplishing some of the above tasks. We used an IDE called Thonny, which is available for all major platforms, and bundles Python3 and PIP together - this package made it easy to get people up and running with Python! It was a great event, and we hope to collaborate with NC State’s NSBE chapter in the future!
Starter files used for the workshop
